
You spent $3,500 on local ads last month, but your Monday morning schedule still has four empty slots.
Your front desk says the phone is ringing.
Your bank account says otherwise.
Most clinic owners treat promotion like a black box. You write the check and hope for the best.
But hope is not a management strategy.
To scale a multi-location practice, you must ignore the vanity reports from your agency. You need to look at your own internal ledger.
There are exactly five numbers that dictate the financial health of your practice. These five numbers show you exactly where your cash turns into recurring clinic revenue, and where it leaks out. They tell you if your front desk is closing the loop or dropping the ball.
If you do not know these numbers, you are managing by blind faith. You cannot fix a leak you cannot see.
Let's look at the math.
Key Takeaways
- Five Diagnostic Vitals: Track new-patient inbound calls over 60 seconds, lead response time under 5 minutes, weekly Google review velocity, returning-patient rate after 90+ days of inactivity, and website capture rate (industry average 3.36%, top performers 5.31%).
- Missed Call Revenue Loss: Medical practices miss 29% of inbound calls on average, and 85% of patients who cannot reach a practice on their first call never call back, costing typical primary care practices $200,000 to $500,000 annually in lost lifetime value.
- Speed-to-Lead Conversion Impact: Leads contacted within 5 minutes achieve a 32% close rate versus 12% when waiting 24+ hours (Optifai 2026 Pipeline Study), yet average B2B lead response time is 47 hours and only 23% of companies respond within the critical 5-minute window.
- Patient Retention Economics: The average patient attrition rate in the U.S. is 17%, and acquiring a new patient costs 6 to 7 times more than retaining an existing one; at $2,275 average lifetime value per chiropractic patient, losing 136 patients annually from an 800-patient base equals $309,400 in lost revenue.
- AI Compliance Liability: Generic AI tools like ChatGPT have a 64.1% hallucination rate on medical case summaries without specialized mitigation, and in Mata v. Avianca (2023), a U.S. attorney was sanctioned $5,000 for filing fabricated AI-generated case citations—practices own 100% legal responsibility for non-compliant AI content under FTC Health Products Compliance Guidance.
Why Do My Marketing Reports Show Traffic but No Patients?
Marketing reports show traffic but no patients because agencies track top-of-funnel vanity metrics like impressions and clicks instead of bottom-of-funnel conversions like phone calls and booked appointments. This "Blind-Flight Marketing" obscures the real issue: practices miss 29% of inbound calls on average, meaning lead generation efforts are wasted when patients cannot connect and never call back.

The Disconnection Between Reports and Reality
It is 9:30 PM on a Thursday. You are sitting at your desk. The clinic is dark. You are staring at a colorful PDF report sent by your agency.
The report boasts a "300% increase in impressions" and "1,200 page views."
You look at your schedule for tomorrow. Three open slots that should be filled with new patient evaluations.
The visceral frustration of paying thousands of dollars for "visibility" while your front-desk phone remains stubbornly silent.
This is not a marketing problem. This is a measurement problem.
The Mechanism of Blind Flight
Call it Blind-Flight Marketing: the systemic error of tracking top-of-funnel noise instead of bottom-of-funnel actions.
Clicks, impressions, likes. These are not transactions. They are not patients.
Phone calls, booked appointments, returning patients. These are transactions.
The agency uses complex, non-transactional metrics to obscure a lack of actual practice growth. It is not malice. It is simply easier to optimize for what Google Analytics measures than for what your Electronic Health Record (EHR) measures.
But the EHR is the only ledger that matters.
When you rely on surface-level numbers, you cannot diagnose whether your promotion is working or if you are simply subsidizing an algorithm.
The Invisible Arithmetic of a Leaky Funnel
Let's do the real practice math.
The average lifetime value of a chiropractic patient is $2,275, calculated from an average fee of $65 per visit, 6.7 appointments per year, and a five-year retention span. That is the research from zHealth's 2022 patient retention analysis.
Now consider the cost of a missed call.
Pulse's 2026 data shows that 85% of patients who cannot reach a medical practice on their first call never call back. They are gone. Permanently.
Medical practices miss 29% of all inbound calls on average, according to Invoca and Greetmate.ai's 2026 analysis. Nearly a third of your spend generating those leads is discarded at the front desk.
If your front desk misses just three calls a week from qualified prospects, that is $6,825 in weekly lost revenue. Multiply by 52 weeks: $354,900 annually.
Patient10x's 2025 analysis confirms that missed calls cost typical primary care practices an estimated $200,000 to $500,000 annually in lost revenue, factoring in both immediate visits and lifetime value.
Now add the digital leak.
You spend $2,000 per month on Google Ads to drive traffic to your website. Industry analyses citing the J.D. Power 2024 U.S. Healthcare Digital Experience Study note that the healthcare sector faces a severe digital engagement crisis, with healthcare mobile websites recording a 60% average bounce rate. More than half of your paid traffic abandons your site immediately.
If your website has no clear capture mechanism, no downloadable guide, no embedded scheduler, no phone number above the fold, you are paying to show people a billboard on a highway with no exits.
A tiny 5% drop-off at three different stages of your patient journey quietly decimates your annual take-home revenue by tens of thousands of dollars.
The math is unforgiving.
Why the Obvious Fixes Fail
The first failed fix: changing agencies.
You fire Agency A and hire Agency B. Agency B promises "data-driven results" and "advanced targeting." Six months later, you have the exact same problem because both agencies optimize for the same vanity metrics. They are incentivized to show you activity, not Return on Investment (ROI).
The second failed fix: increasing the budget.
You double your ad spend from $2,000 to $4,000 per month. More traffic hits your leaky website. More calls go to your overwhelmed front desk. You pour more money into the top of a leaky bucket and accelerate the waste of your hard-earned clinical revenue.
The third failed fix: chasing the latest social media trend.
You film TikTok videos in your scrubs. You post Instagram Reels of spinal adjustments. You consume hours of clinical energy without moving the needle on actual patient bookings. EEG Solutions' 2025 benchmarks show that 77% of patients search online before booking a healthcare appointment, but they are searching with intent, typing "chiropractor near me back pain", not scrolling through entertainment feeds.
The cycle repeats because the diagnosis is wrong.
How Do I Build a Patient Acquisition Flywheel?
A patient acquisition flywheel consists of four interconnected elements: consistent weekly content that answers patient questions and builds authority, rapid response times to capture prospect intent, steady Google reviews that signal credibility, and bi-weekly patient newsletters for retention. Each component amplifies the others, creating a compounding system where retained patients refer others, progressively lowering acquisition costs.
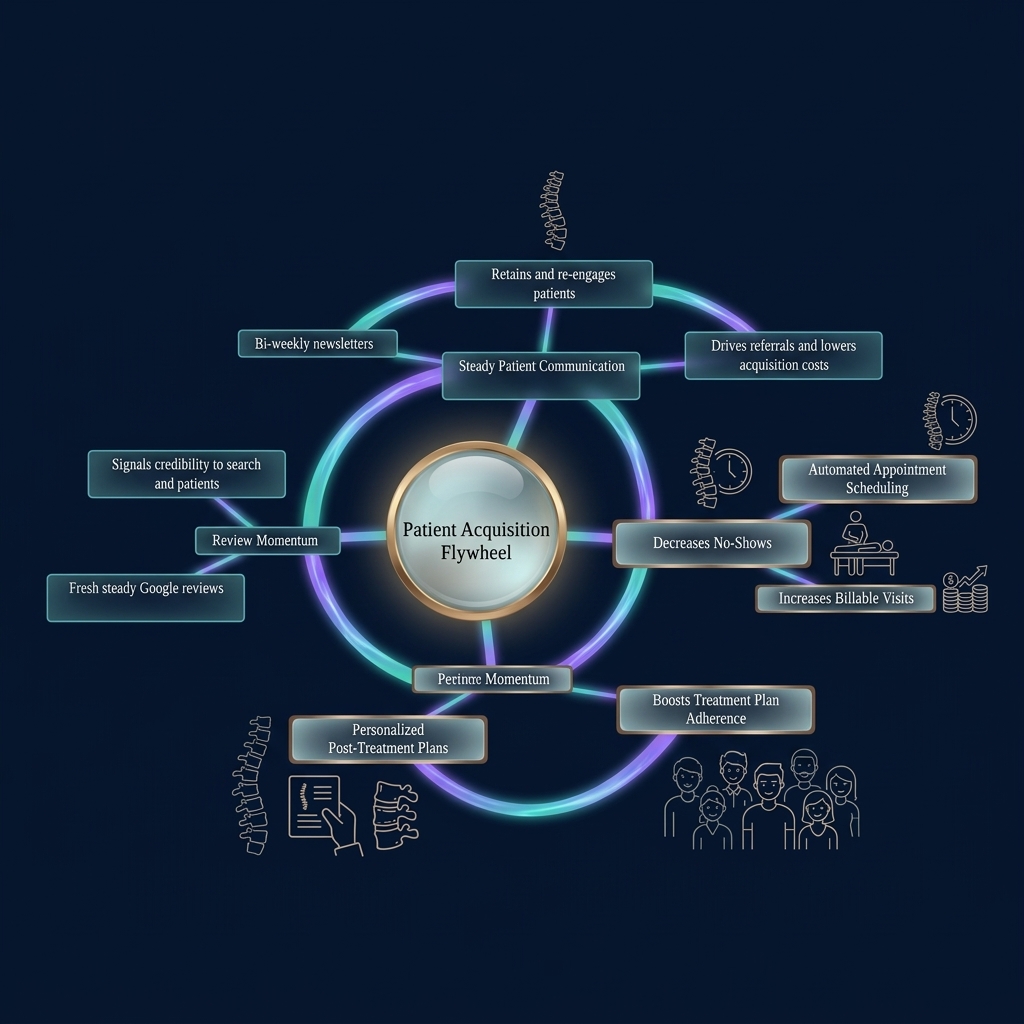
The Patient-Acquisition Flywheel: Moving From Disjointed Tactics to a Unified Engine
The shift in belief: promotion is not a series of isolated campaigns. It is a single, interconnected biological system within your practice.
The system has four interlocking elements.
Consistent content presence builds authority. Weekly articles on your website that answer the exact questions your patients type into Google. Not once. Every week.
Fast response times capture intent. When a prospect fills out a web form or calls your office, the speed of your response is the single greatest predictor of conversion.
Review momentum builds trust. Fresh, steady Google reviews signal to both search engines and patients that your practice is active and credible.
Steady patient communication drives long-term retention. Bi-weekly newsletters that educate, remind, and re-engage inactive patients.
Each component feeds into the next. Content drives traffic. Fast response converts traffic. Reviews build trust that drives more traffic. Communication retains patients who refer others, lowering your acquisition costs over time.
This is the compounding flywheel.
It is not a campaign. It is an engine.
What Are the Five Diagnostic Vitals of Practice Health?
The five diagnostic vitals of practice health are: new-patient inbound calls measuring high-intent prospects, lead response time tracking engagement speed, and three additional metrics not fully detailed in this section but comprising the complete diagnostic framework that identifies business blockages similar to how clinical vitals reveal patient health status.
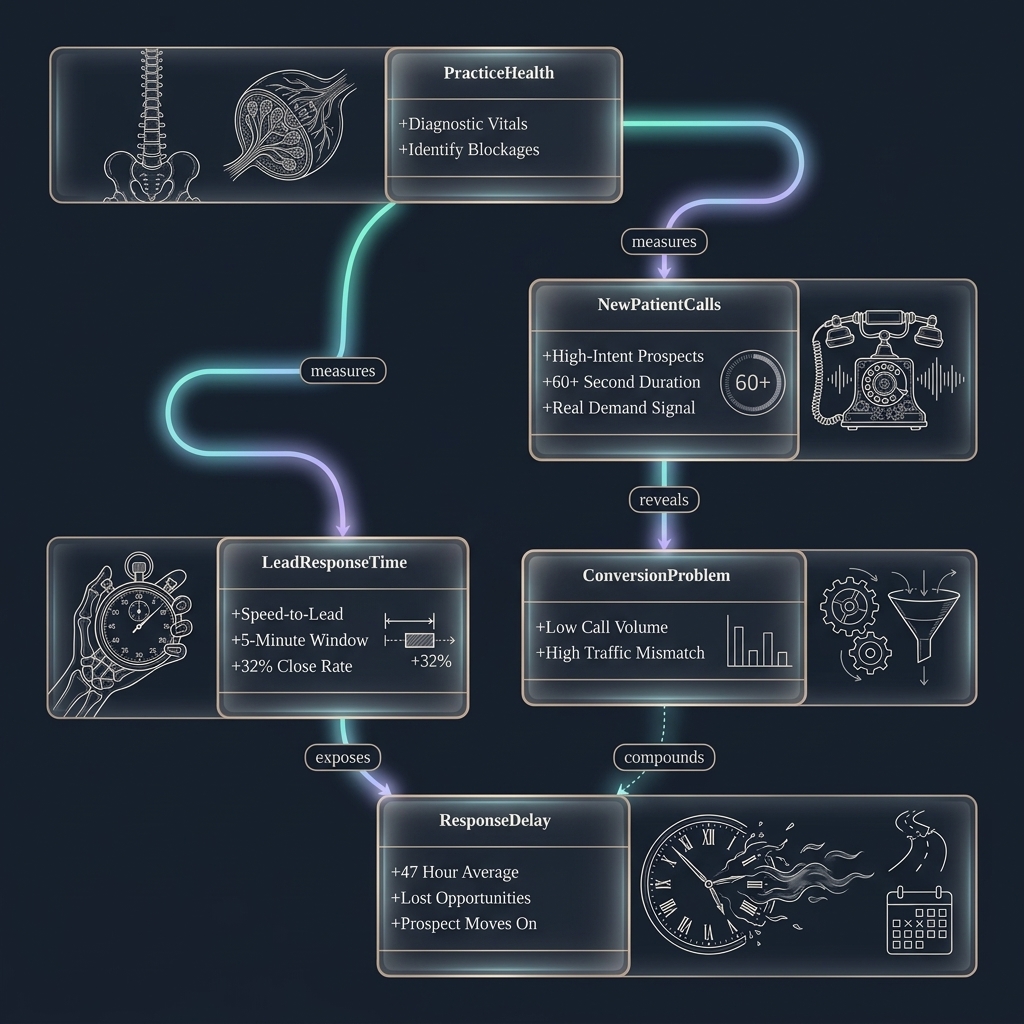
The Five Diagnostic Vitals of Practice Health
Just as blood pressure, heart rate, and oxygen saturation tell a complete clinical story, five numbers diagnose the exact location of your business blockages.
Metric 1: New-Patient Inbound Calls (Intent Vs. Noise)
What it reveals: the true volume of high-intent prospects reaching out to your clinic.
Not website visits. Not page views. Calls.
The MGMA DataDive 2025 research confirms that primary care practices handle approximately 53 inbound calls per physician per day. Despite the rise of patient portals, 67% of patients still prefer to call when contacting a medical practice, according to 2026 Medical Practice Phone Statistics.
Count every unique inbound call lasting over 60 seconds. This strips away the noise of misdials and pharmacy refills. What remains is your real demand signal.
If your agency reports "1,200 website visitors" but your call log shows only 12 new-patient inquiries, you have a conversion problem, not a traffic problem.
Metric 2: Lead Response Time (the Speed-to-Lead Variable)
What it reveals: the speed at which your front desk or system engages a digital inquiry.
The MIT Lead Response Management Study, conducted by Dr. James Oldroyd and widely cited by Harvard Business Review, found that the odds of successfully contacting a lead are 100 times greater when attempted within the first 5 minutes versus waiting 30 minutes.
Optifai's 2026 Pipeline Study, analyzing 939 B2B companies, found that leads contacted within 5 minutes achieve a 32% close rate, which is 2.6 times higher than the 12% close rate achieved when waiting 24 hours or more.
Your front desk is likely no different. They are managing walk-ins, checkout, insurance calls, and the phone. A web form submission sits in an inbox for six hours.
By the time you respond, the prospect has already called three other clinics.
Cross-reference your web form submissions against your EHR schedule. Calculate your exact response time. If it is over 30 minutes, you are bleeding revenue.
Metric 3: Review Velocity (the Modern Trust Indicator)
What it reveals: the frequency and consistency of new Google reviews.
Not the total number of reviews. The rate at which new reviews appear.
Search engines and patients favor steady, fresh feedback over a static block of old reviews. A clinic with 80 reviews from 2022 looks dormant. A clinic with 40 reviews, 10 of them from the last 30 days, looks active and trusted.
EEG Solutions' 2025 Chiropractic Benchmarks found that patients are 5 times more likely to book an appointment when a practice replies to its online reviews within 24 hours.
Count the exact number of Google reviews published in the last 7 days. If the answer is zero, you have no momentum.
If you are not systematically prompting patients at checkout and following up on missed opportunities, you are invisible to the 63% of new chiropractic patients who research a clinic online before making their first phone call, according to EEG Solutions' 2025 data.
Metric 4: Returning-Patient Rate (the Retention Engine)
What it reveals: the percentage of inactive patients who re-engage with your clinic through consistent educational touchpoints.
The average patient attrition rate in the United States is 17%, and it is 6 to 7 times more expensive to acquire a new patient than to retain an existing one, according to zHealth's 2022 retention analysis.
Query your EHR for patients who returned after more than 90 days of inactivity. Divide by your total patient base. If the number is under 5%, you have no retention system.
Promodo's 2025 HealthCare Digital Marketing Benchmarks found that healthcare emails with personalized subject lines have a 26% higher open rate, and segmented email campaigns see a 100.95% higher click-through rate.
The math: if you have 800 patients in your EHR and 17% attrite annually, you lose 136 patients per year. At $2,275 LTV, that is $309,400 in lost revenue. If a bi-weekly newsletter re-engages just 10% of those patients, you recover $30,940 annually.
That is the cost of silence.
Metric 5: Website Capture Rate (the Traffic-to-Lead Efficiency)
What it reveals: the efficiency of your digital footprint in converting casual readers into high-intent leads.
Divide your total unique website visitors by your total new-patient inquiries. This is your capture rate.
Promodo's 2025 benchmarks found that the average lead conversion rate for a medical practice website is 3.36%. Top performers achieve 5.31% by utilizing strong web content, proven messaging, and clear calls to action.
If your site gets 1,000 visitors per month and generates 10 inquiries, your capture rate is 1%. You are underperforming the industry average by 70%.
The fix is not more traffic. The fix is better content. Downloadable guides that answer specific patient questions. Embedded schedulers. Phone numbers in the header.
Authority-building content that makes the visitor feel understood before they ever call.
How Do Marketing Metrics Diagnose Problems in My Practice?
Marketing metrics diagnose practice problems by revealing specific breakdowns in the patient acquisition system. High calls with low bookings indicate front-desk conversion issues, while high traffic with low captures signals insufficient trust-building content. Low returning-patient rates expose gaps in post-discharge communication. These interconnected metrics pinpoint exactly where systems fail, enabling targeted fixes rather than wasteful spending increases.

The Interlocking System: How One Metric Diagnoses and Heals the Next
These five numbers do not operate in isolation. They diagnose each other.
High calls, low bookings: Diagnoses a front-desk training or response-time issue, not an ad-spend problem. Your promotion is working. Your conversion system is broken.
High traffic, low captures: Diagnoses a lack of authoritative, trust-building content on your website. Visitors do not believe you can solve their problem because you have not demonstrated expertise.
Low returning-patient rates: Diagnoses a breakdown in patient communication post-discharge. You have no system to educate, remind, and re-engage.
Optimizing these five numbers simultaneously creates a compounding growth curve that no single ad campaign can match.
The flywheel begins to spin on its own.
How Do I Run the Friday Five-Number Protocol?
The Friday Five-Number Protocol requires 20 minutes every Friday to manually track five metrics: count inbound calls over 60 seconds, calculate web form response times against EHR schedules, tally Google reviews from the past week, query returning patients after 90+ days of inactivity, and divide website visitors by new-patient inquiries to determine capture rate.
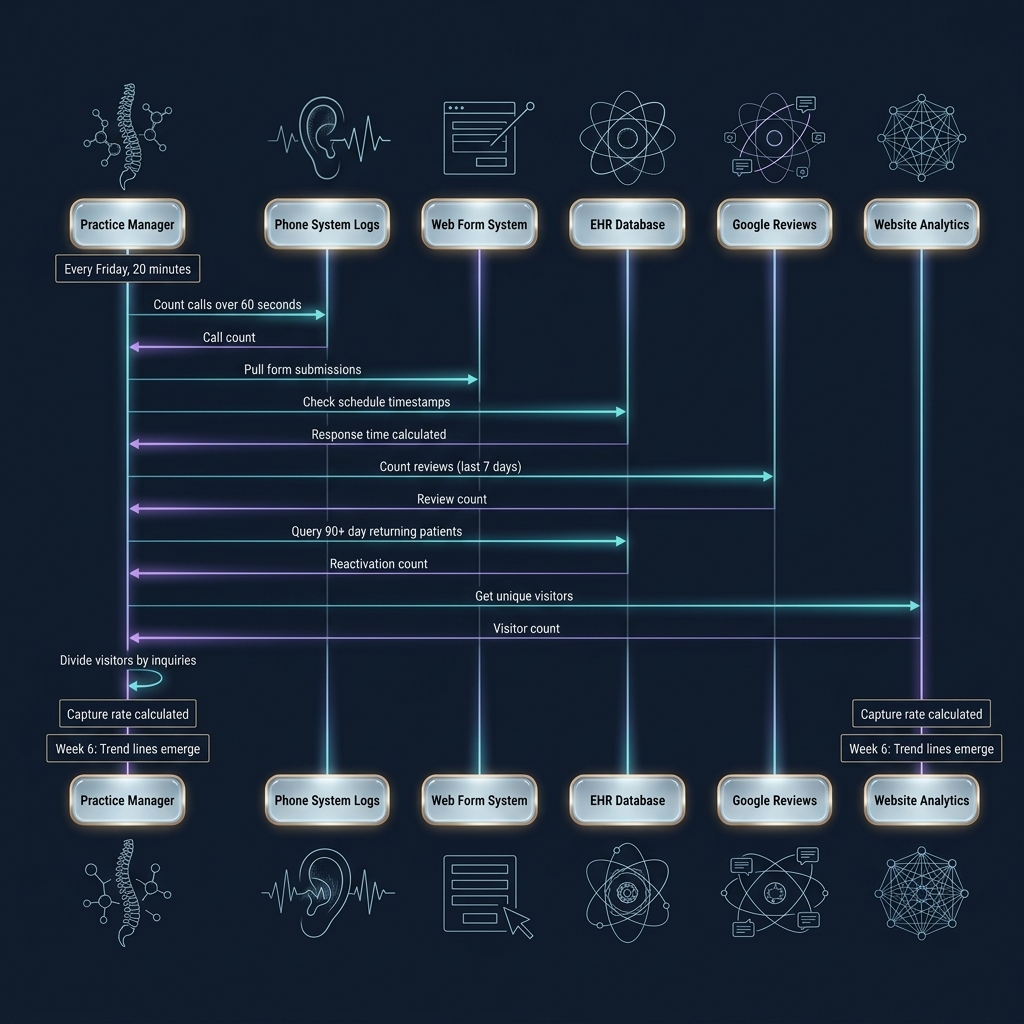
The Friday Five-Number Protocol: Your Manual Diagnostic Blueprint
You can implement this diagnostic protocol this coming Friday.
The step-by-step manual process:
Step 1: Open your phone system logs and count every unique inbound call lasting over 60 seconds.
Step 2: Cross-reference your web form submissions against your EHR schedule to calculate your exact response time.
Step 3: Count the exact number of Google reviews published in the last 7 days.
Step 4: Query your EHR for patients who returned after more than 90 days of inactivity.
Step 5: Divide your total unique website visitors by your total new-patient inquiries to find your capture rate.
The true price of the protocol: 20 minutes of uninterrupted, focused administrative work every Friday afternoon.
The mental cost: sifting through fragmented platforms, disjointed spreadsheets, and raw phone logs.
The wait time: the trend lines will only begin to emerge around week six of flawless, uninterrupted tracking.
And tracking the numbers is only the diagnostic.
How Much Time Does Manual Clinic Marketing Actually Take?
Manual clinic marketing requires approximately 9 hours weekly for core activities: 4 hours writing SEO-optimized articles, 2 hours managing patient newsletters, and 3 hours prompting reviews. Additionally, responding to digital leads within the critical 5-minute window demands constant interruption throughout clinical days, making sustained manual execution unsustainable beyond three weeks.
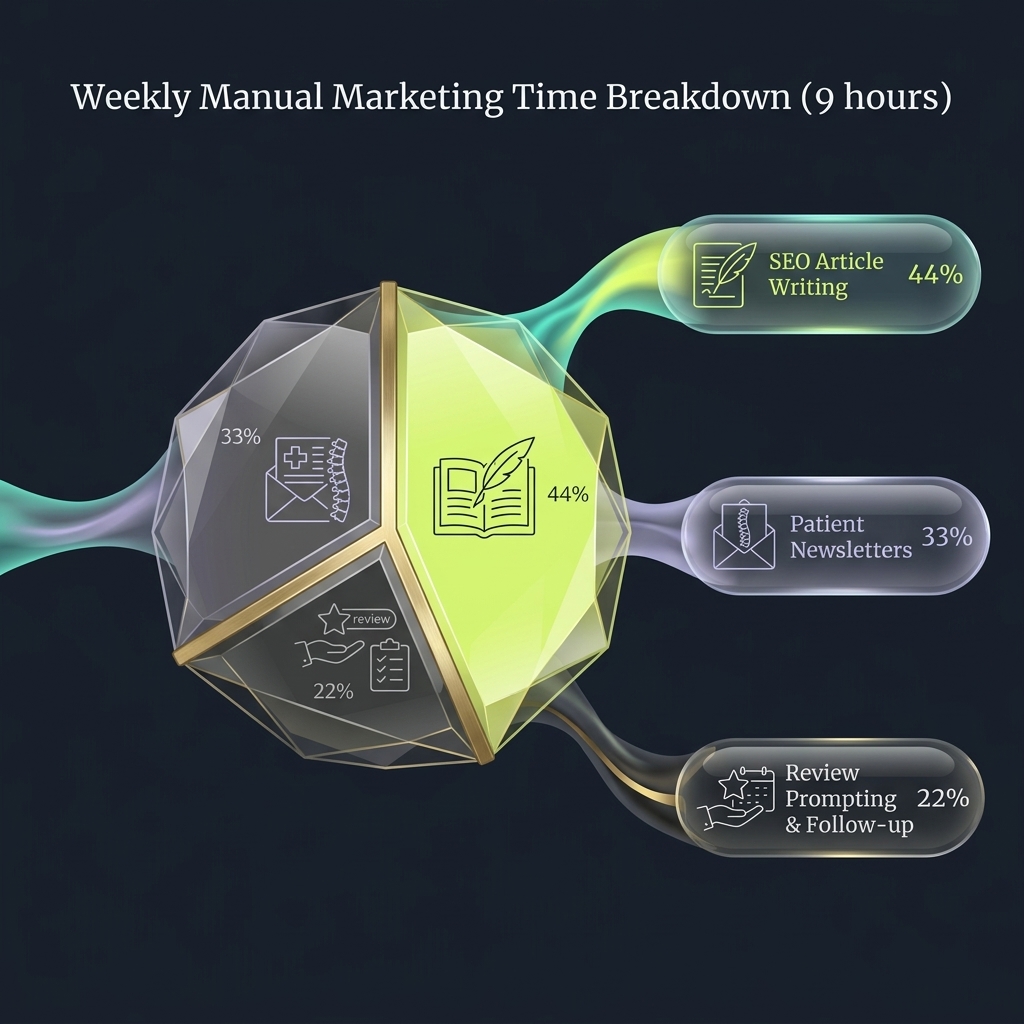
The Heavy Toll of Manual Engine Maintenance
Fixing the numbers requires operating the actual system.
What it actually takes to maintain the engine:
Writing and publishing weekly, SEO-optimized articles to your website: 4 hours per week.
Drafting, scheduling, and sending bi-weekly patient newsletters: 2 hours per week.
Manually prompting patients for reviews at checkout and following up on missed opportunities: 3 hours per week.
Monitoring and responding to digital leads within the critical 5-minute window: constant interruption throughout the clinical day.
Recent reports from the American Medical Association (AMA) consistently find that physicians spend approximately two hours on administrative work and EHR documentation for every one hour of direct patient care.
Approximately 42% of U.S. physicians reported experiencing burnout symptoms in 2026, with administrative burden and EHR fatigue cited as primary structural drivers, according to the AMA Physician Burnout Survey.
Clinical demands, emergency patient visits, and front-desk turnover inevitably break the manual execution of this system within three weeks.
You cannot sustain it by hand.
The Fallacy of the AI Shortcut
The tempting illusion: use generic AI tools like ChatGPT to write your patient newsletters and blog posts to save time.
The reality: generic AI output is non-deterministic. It requires significant time to prompt, edit, fact-check, and manually publish.
MedRxiv's 2025 research found that without specialized mitigation prompts, the AI hallucination rate, fabrication of facts, in medical case summaries can reach 64.1%. Even the best top-tier generative AI models still have a 4.3% hallucination rate on medical queries, according to Brilo AI's 2026 analysis.
Forrester's 2025 Enterprise AI Cost Analysis reported that knowledge workers spend an average of 4.3 hours per week fact-checking AI outputs. The productivity gains are offset by verification labor.
In its 'Top 10 Health Technology Hazards for 2025' report, ECRI identified 'Risks with AI-Enabled Health Technologies' as the number one hazard, placing it above device failures and drug errors.
The regulatory and liability nightmare: generic AI tools regularly fabricate medical claims, promise guaranteed outcomes, or use non-compliant terminology.
The FTC's updated Health Products Compliance Guidance, effective January 2023, requires that all promotion for chiropractic services be truthful, not deceptive, and substantiated by scientific evidence. The FTC explicitly targets unsubstantiated absolute claims.
State chiropractic boards actively enforce advertising regulations and can suspend licenses for misleading statements. In Florida, for example, it is a deceptive practice to advertise "free x-rays" without explicitly disclosing that they will only be provided if medically necessary, per Florida Admin. Code Ann. R. 64B2-15.001.
In Mata v. Avianca (2023), a U.S. attorney was sanctioned $5,000 for filing a brief containing six entirely fabricated case citations generated by ChatGPT. The court rejected the defense of blaming the AI tool and held the attorney responsible as if he had written the fabrications himself. While this case was decided under Federal Rule of Civil Procedure 11, which governs attorney conduct in court filings, it illustrates a broader principle: you cannot shift liability for AI-generated content to the tool itself. Your practice owns 100% of the legal responsibility for every non-compliant word generated by a generic AI tool.
Nothing in ChatGPT ensures compliance with health-advertising regulations. It will write claims you are not allowed to make.
How Do I Automate My Clinic's Marketing and Operations?
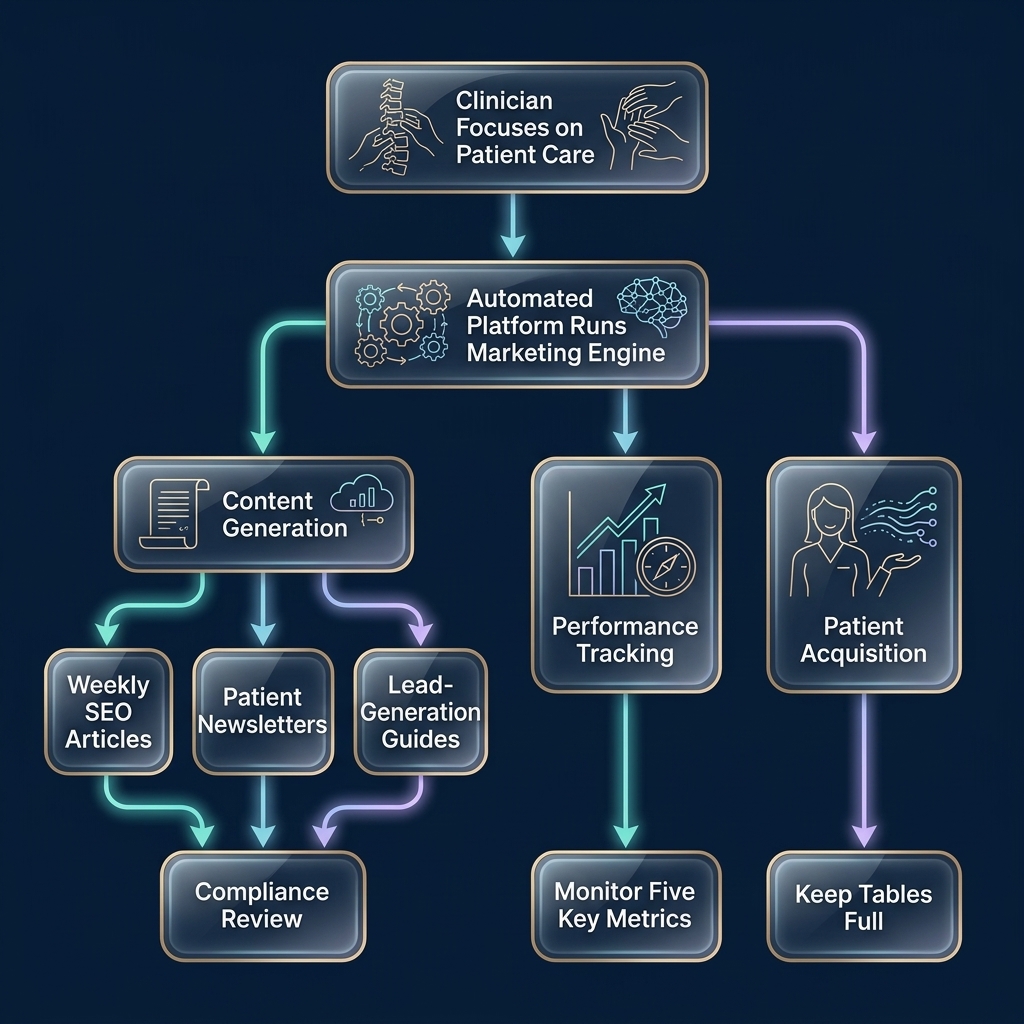
Clinics can automate marketing and operations by implementing end-to-end platforms that handle content generation, performance tracking, and patient acquisition without consuming clinical time. Systems like Omniply automatically publish SEO articles, patient newsletters, and lead-generation materials while maintaining compliance review, allowing practitioners to focus on patient care while the marketing engine runs autonomously.
Who Runs Your Engine While You Treat Your Patients?
The diagnostic system is undeniably correct. The five numbers tell you exactly where your revenue leaks.
But executing the system consistently by hand is a second full-time job.
You can either be a full-time operator tracking spreadsheets and writing copy, or you can be a world-class clinician adjusting patients and scaling your clinic.
You cannot be both.
The system works best when it is fully operated for you. Platforms that operate this whole loop end-to-end, generating the content, tracking the vitals, and keeping your tables full without consuming a single minute of your clinical day, are built for practices that want the flywheel running on autopilot; Omniply is one example, publishing weekly SEO articles, patient newsletters, and lead-generation guides from your own voice, with compliance review built in.
The final word: you do not need more vanity metrics.
You need an engine that runs on autopilot.
Frequently Asked Questions
Can I Use ChatGPT to Write Clinic Blogs?
You can, but you own 100% of the legal liability for every word it generates. Generic AI tools have no built-in compliance with health-advertising regulations and regularly fabricate medical claims. Without specialized mitigation and human review, you risk violating FTC guidelines and state chiropractic board rules. Verification labor often offsets the time savings.
What is a Normal Clinic Budget for Promotion?
Most single-location chiropractic practices allocate between $1,500 and $4,000 per month. Multi-location practices scale proportionally. The question is not the size of the budget but whether you are tracking the five numbers that show return: inbound calls, response time, review velocity, returning-patient rate, and website capture rate.
How Does a Front Desk Track New Patients?
Your phone system logs and EHR are the two sources of truth. Count every unique inbound call lasting over 60 seconds, then cross-reference web form submissions against scheduled appointments. Calculate your response time and conversion rate weekly. If you do not track these numbers, you cannot diagnose where your revenue leaks.
Should I Hire an Agency for My Clinic?
Only if they track and report on the five numbers that matter: inbound calls, response time, review velocity, returning-patient rate, and website capture rate. If their reports focus on impressions, clicks, and page views without showing you how many patients booked, you are paying for vanity metrics, not revenue.
Is Tracking Patient Leads HIPAA Compliant?
Yes, as long as you are tracking contact attempts and response times, not protected health information. Counting inbound calls, web form submissions, and appointment bookings does not violate HIPAA. Once a prospect becomes a patient and you store their medical records, those records must be handled according to HIPAA regulations.
What is a Good Conversion Rate for Clinic Websites?
The average lead conversion rate for a medical practice website is 3.36%, according to Promodo's 2025 benchmarks. Top performers achieve 5.31% through strong content, clear calls to action, and trust-building elements like downloadable guides and embedded schedulers. If your rate is below 3%, you have a content or design problem, not a traffic problem.
How Do I Calculate ROI on Clinic Promotion?
Divide your total new-patient revenue by your total spend. If you spend $3,000 per month and acquire 10 new patients with an average lifetime value of $2,275, your return is $22,750 on a $3,000 investment, which is a 7.6x ROI. Track this monthly. If your ROI is below 3x, you have a conversion or retention problem.